
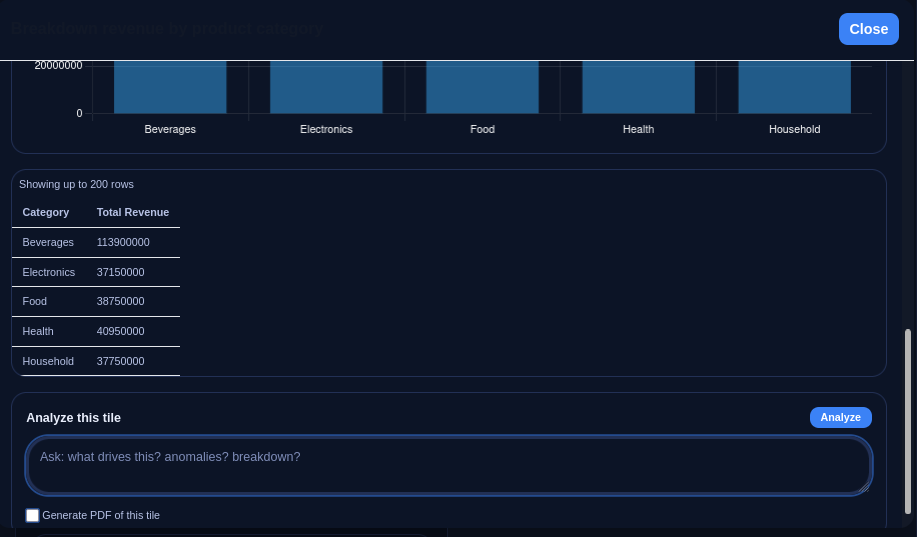
Regional sales breakdown
Understand which regions are contributing most to revenue and how the distribution changes over time.
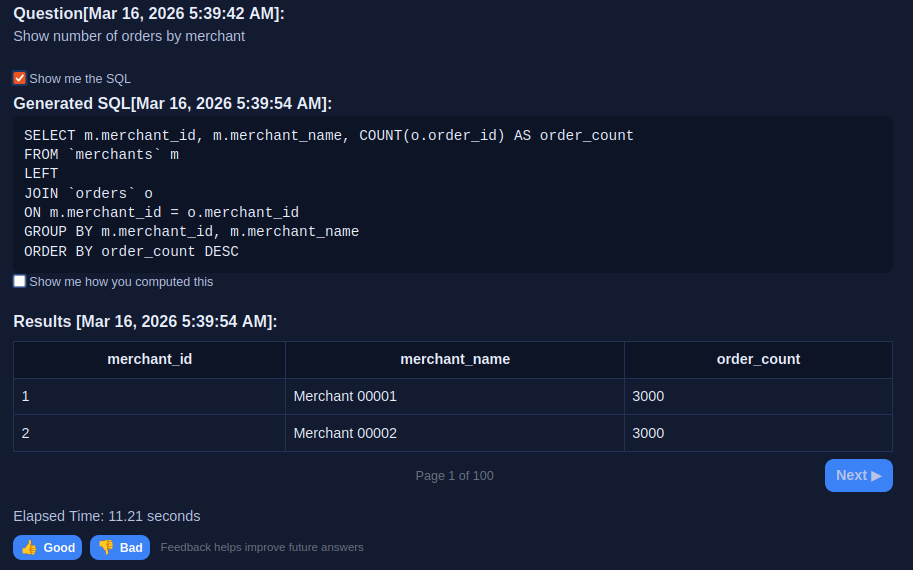
Sentory is designed for teams that need faster access to insight without giving up transparency, control, or the ability to inspect generated SQL.
Understand which regions are contributing most to revenue and how the distribution changes over time.
Analyze category contribution and compare segments at a glance.
Most teams begin with a product demonstration and a focused pilot. This allows you to validate query accuracy, workflow fit, and team adoption using your own data.
Request Preview