
Transparent SQL generation
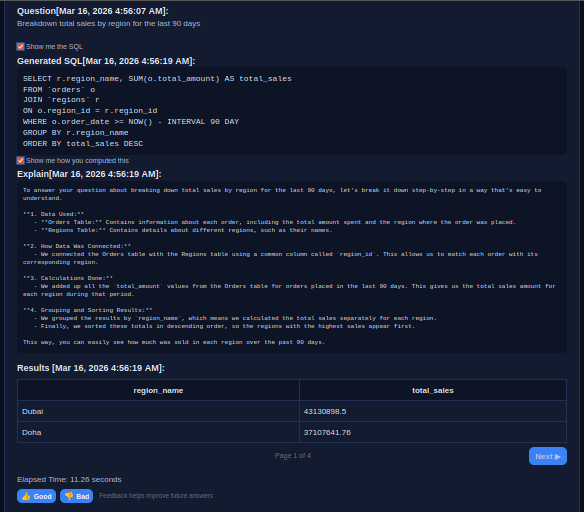
Generated SQL remains visible for validation, explainability, and trust in analytics workflows.
Ask questions about your data in plain language. Sentory automatically generates transparent SQL and returns interactive visual insights in seconds.
Sentory helps teams move from business question to validated result without jumping between dashboards, ad-hoc SQL, and reporting queues.
Use plain language to ask about sales, customers, products, regions, trends, and operational performance.
The platform translates the request into SQL automatically and keeps the query visible for review and trust.
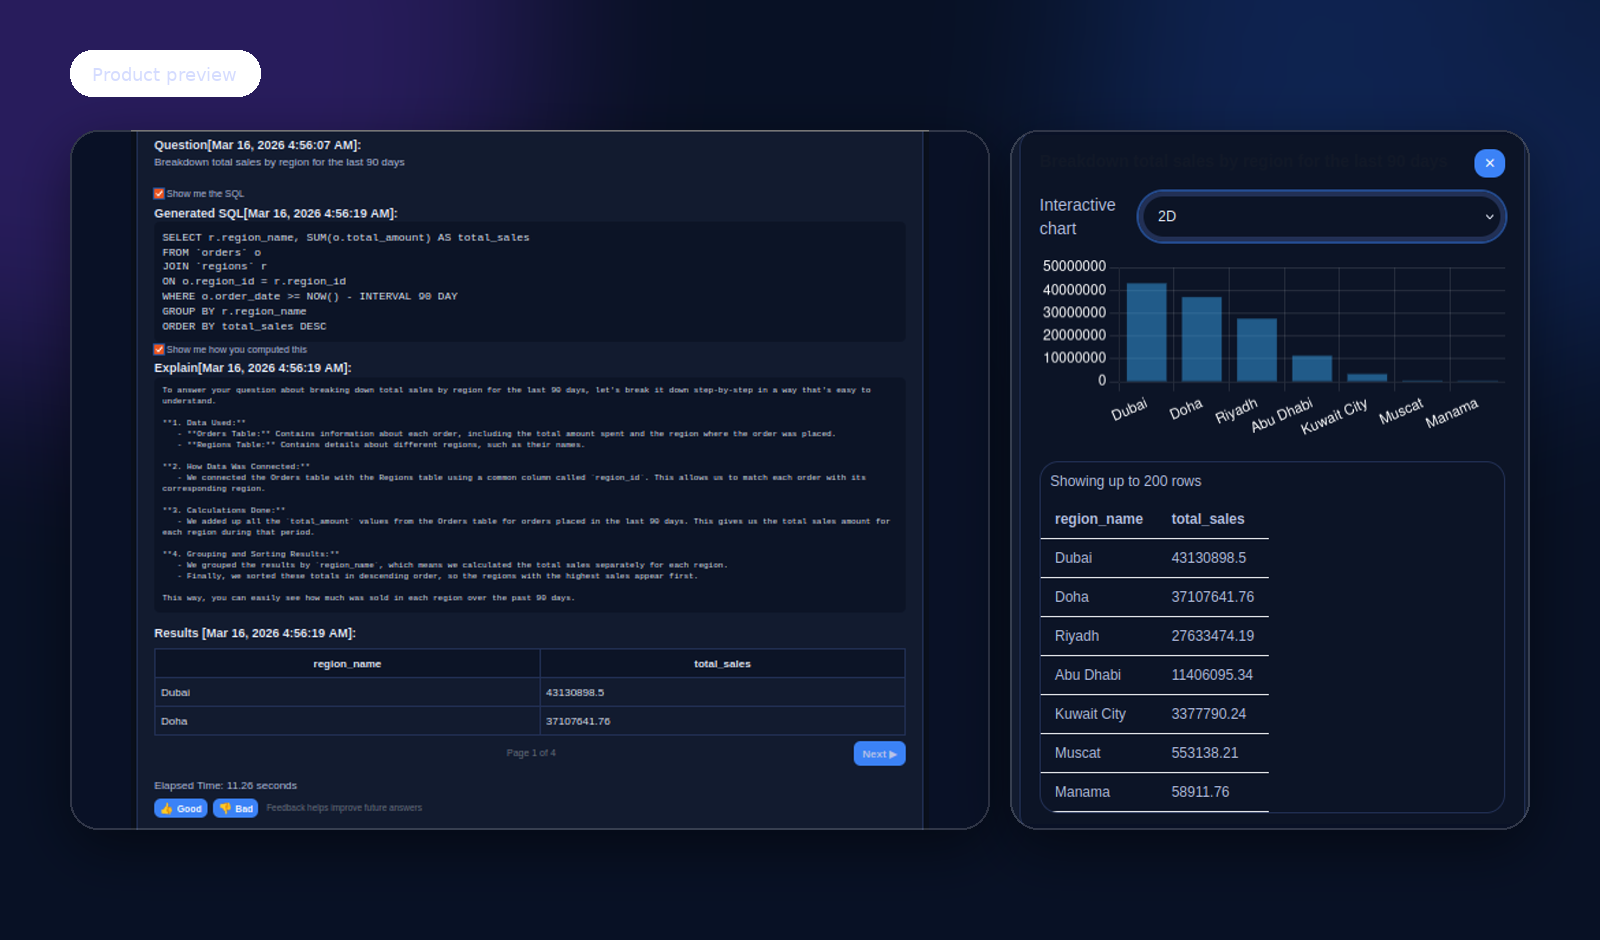
Results appear as tables, charts, dashboard-ready, pinned interactive dashboard tiles, on demand graphs and charts, unlimited drill downs, data analysis and shared generated PDF reports so teams can analyze quickly and share confidently.
Ask questions without writing SQL or building new dashboards for every request.
Generated SQL remains visible and auditable instead of hidden behind a black-box answer.
Explore data through tables, charts, and dashboard tiles with flexible visual drill-down.
Review prior questions, results, and generated SQL to support continuity and governance.
The screenshots below show the core Sentory flow: natural language question, generated SQL, and visual exploration of the result.
Generated SQL remains visible for validation, explainability, and trust in analytics workflows.
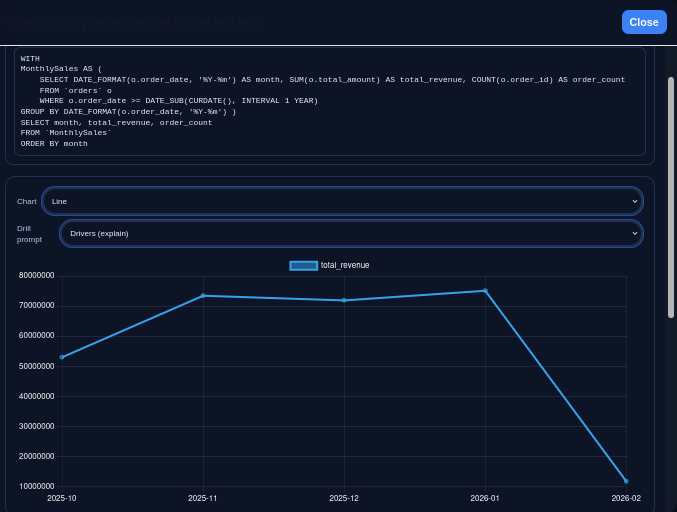
Analyze business trends over time using natural language questions and interactive charting.
Traditional BI tools excel at dashboards but still depend heavily on manual data work. Many AI analytics tools are fast but opaque. Sentory sits in the middle — natural language analytics with visible SQL, explainability, and operational control.
Sentory is currently introduced through focused product demonstrations and pilot discussions. Tell us a little about your team, data environment, and evaluation goals and we’ll follow up.
Request Preview